Independence
What’s the difference between “linear correlation” or “correlation”, and “statistical dependence”? Succintly, “linear correlation” is a much more specific relationship between two variables than “statistically dependent”. In words, linear correlation means that as one variable goes up by some amount, the other one goes up by another amount, and the ratio between how much both variables change is constant across the data set. Having stated it this way, you can see how there could be other kinds of correlation–both variables could again change together, but the ratio between how much the two variables change could itself change over the data set. As long as there’s some pattern to how this ratio behaves over the data set, correlation of some kind will be present.
Mathematically, the covariance between the two variables is a measure of their linear correlation (to get the actual correlation coefficient, which is bounded by , you’d have to divide the covariance by the standard deviations of both variables). If our two variables are and , and we’ve centered both of them so they have zero mean, the covariance is
\begin{equation} \mathrm{Cov}(x,y) = \langle xy\rangle = \frac{1}{n} \sum_{i=1}^{n} x_i y_i. \end{equation}
Notice the structure of this expression: inside the , it’s linear in both variables. You could have other expressions like or that could be non-zero even as the covariance is 0. As an example, consider the data for two variables shown in the picture.
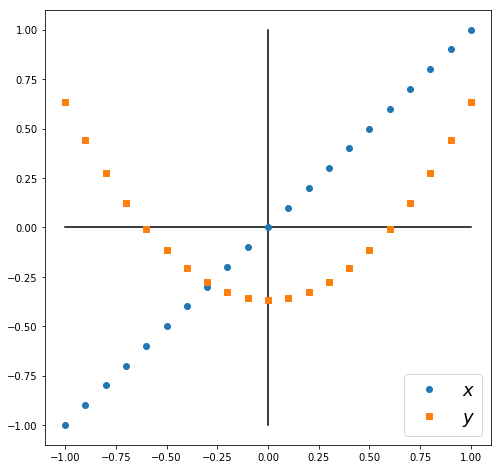
The data points for form a line, and the data points for form a parabola. The two variables are not linearly correlated, because on the left, goes down as goes up, but on the right, goes up as goes up.If you calculate , the first half of the terms would cancel the second half of the terms. But the expression
\begin{equation} \langle x^2y \rangle = \frac{1}{n} \sum_{i=1}^n x_i^2 y_i \end{equation}
would not be zero. An expression like this is called a higher-order correlation, since there are terms of higher order than linear inside the .
Getting back to the main point, you can see now why “linear correlation” is a very specific relationship: it specifies not just that two variables are related, but a certain way those variables are related. A quadratic correlation, like equation above, specifies a different way those variables are related. But in both cases, a relationship exists between the two variables; put another way, in both cases, by observing one variable we get information about the other variable (although we’d have to know how they’re related in order to use this information). This is finally where the term “statistical dependence” comes in. As long as we can get information about one variable by observing another variable, we say the two are statistically dependent. This doesn’t necessarily imply that the variables are linearly correlated, or quadratically correlated, but it does mean that correlations of some kind are present (some expression that looks like is non-zero (is this true, what about log correlations?)).
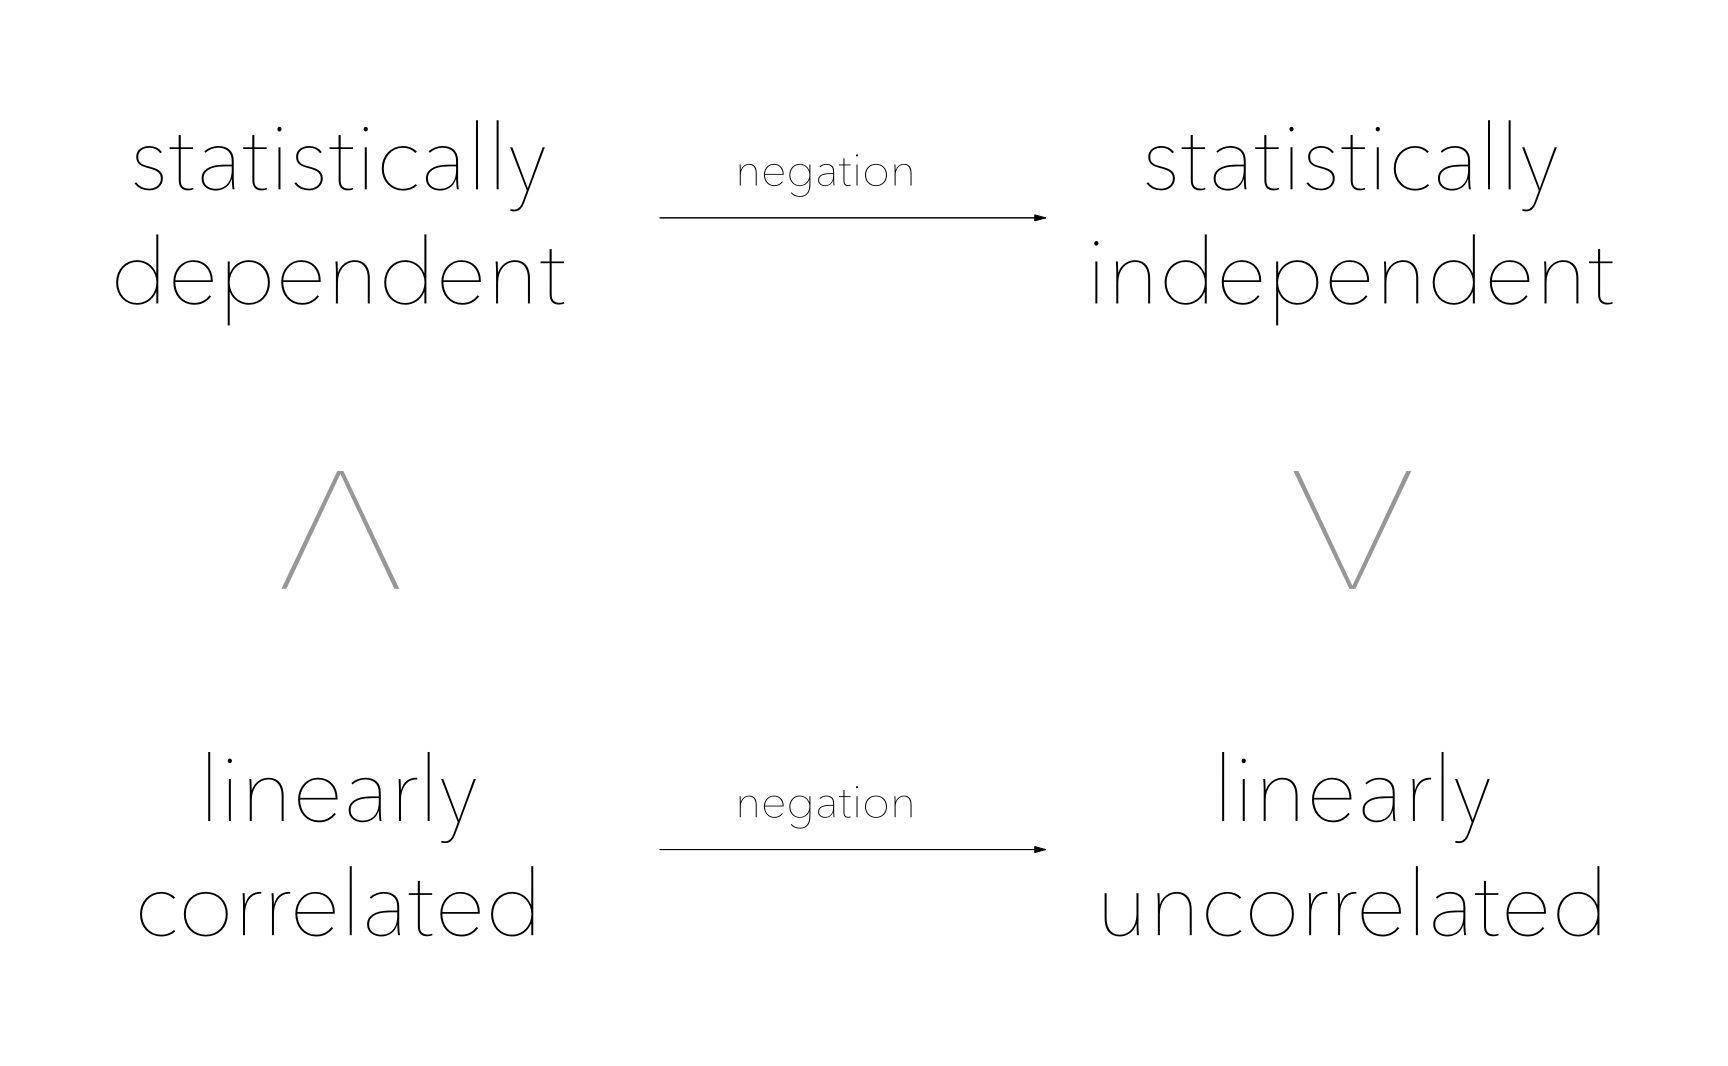
Flipping our terms around, we can see that statistical independence is a much stronger requirement than linearly uncorrelated variables–it implies that correlations of all kinds are 0, whereas “linearly uncorrelated” just means that the expression is 0, and says nothing about higher-order expressions. Look at the left column in the diagram. The ^ implies that “linearly correlated” is a stronger (more specific) claim than “statistically dependent”. But when you negate both terms, the specific/general relationship gets reversed. So on the right, “statistically independent” is a stronger claim and “linearly uncorrelated”.
This is why we specify “statistical independence” in our criterion for ICA, instead of just “uncorrelated”. (What happens if you merely stipulate that the transformed variables are linearly uncorrelated? You get PCA!)